If you have ever been tasked with creating an engineer's estimate for a MnDOT construction project, you have probably researched historic bid prices using the Average Bid Price PDFs published yearly by MnDOT.
These documents contain the total quantity, total cost, average price, and number of contract appearances for each bid item used in a MnDOT construction contract that year. They offer a complete, authoritative, and well-organized summary of how much MnDOT is spending on individual items.
They are not without disadvantages, however. If these annual summaries are your only source of pricing information, you will often be left wanting for several reasons:
Infrequency - Since the documents are only published once per year, and sometimes not for a month or two into the following year, the content can already be slightly dated by the time it is available.
One, at most, data points per year - Since the spending on an item across all projects that year is boiled down to one line, the price variability from project to project is unknown. For instance, the reported average price could be inflated by an exceptionally high price on one project that isn't representative of the average case.
Comparing prices from year to year - These PDFs are more than 100 pages each, so finding an item efficiently already involves text-searching the document. To compare results from one year to another, you'll need to open two PDFs or have recorded the information elsewhere. Not difficult, but cumbersome.
The MnDOT Bid Prices Dashboard application seeks to remedy these points of friction by making available more granular bid pricing data. This is accomplished by extracting, storing, aggregating, and displaying individual bids published in MnDOT's Bid Letting Abstracts. Within these documents are not only bids submitted by the awarded contractor but all bidders and the engineer's estimated prices. From this level of data, the application provides the user with the data necessary to understand pricing variability across time and total quantity and benefit from bid data not yet published in the annual average price documents.
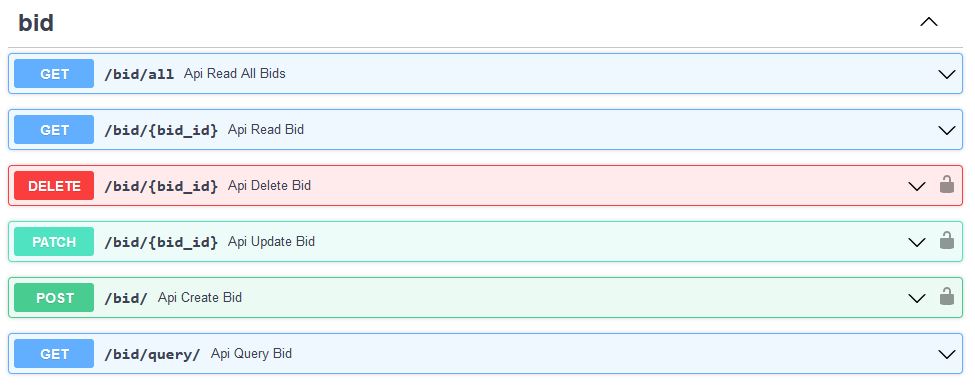
The backend was built using FastAPI to provide routing and operation layers in front of the database. The API provides create, read, update, delete, and query for each of the database tables for manually managing records. The API also provides two extract, transform, load routes that create or update records from data contained in item list and bid abstract CSVs downloadable from MnDOT's Transport List and Bid Letting Abstracts respectively.
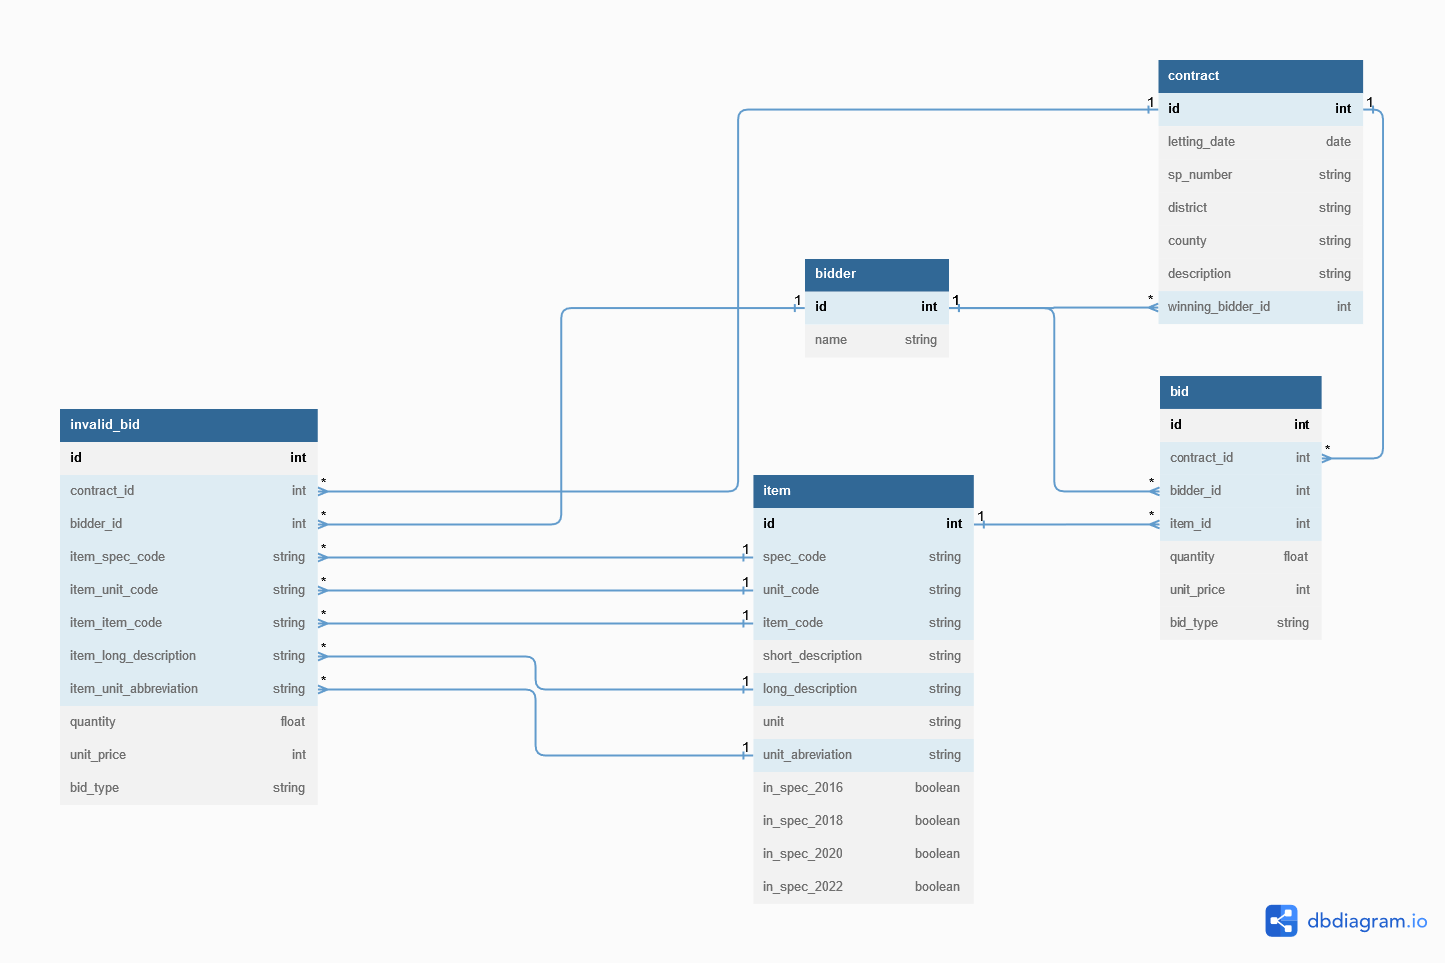
The data model was defined to closely reflect the content and organization of the source CSVs. This design allows records to be prepared for loading into the database with minimal transformation complexity. It also preserves the data as published allowing the backend to be mostly frontend agnostic.
Contract - General project data for a particular abstract
Bidder - Name and ID of prime contractors that have submitted a bid proposal that was ranked among the three lowest
Bid - Unit prices for each item including the engineer's estimate, winning bidder's price, and losing bidder's prices
Invalid Bid - Bid records for items that do not conform to items in the Transport List
Item - Items from the Transport List
The ETL process is achieved through two critical libraries: Pandas and Pandera.
Pandas is used to read the uploaded CSV into DataFrames, transform the content of those DataFrames to match the schema of the destination database table, and iteratively pass those records to the appropriate create or update operation.
Pandera is a DataFrame validation library and plays a key role in verifying that the records loaded into the database through the ETL process conform to the desired schema. For each step in the process, a Pandera Schema Model is defined with custom validations to ensure that the intermediate data products contain all the requisite columns and proper types that the next step needs. Not only does this allow for defining predictable results from the transformations, but also enables broad error handling coverage so that the process can handle appropriately malformed inputs without crashing the server.
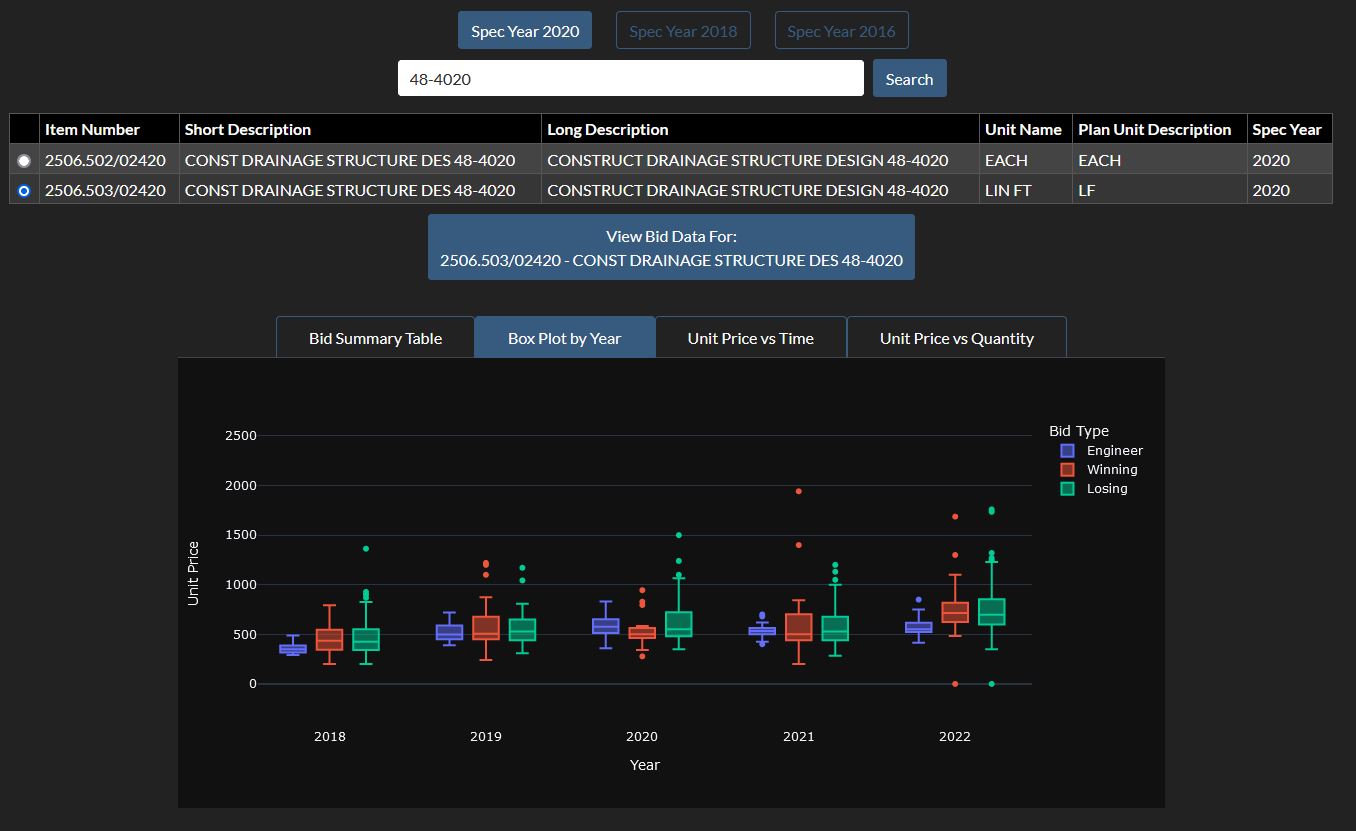
The dashboard is a single page web application built with the Dash-Plotly framework. I chose this framework because it has a Python API, takes Pandas DataFrames as input to its graphs, and is an extension of Flask, all of which I am already familiar with which significantly reduced the time to build this first release. It is a little rough around the edges, but this initial build provides the core functionality I had hoped to achieve:
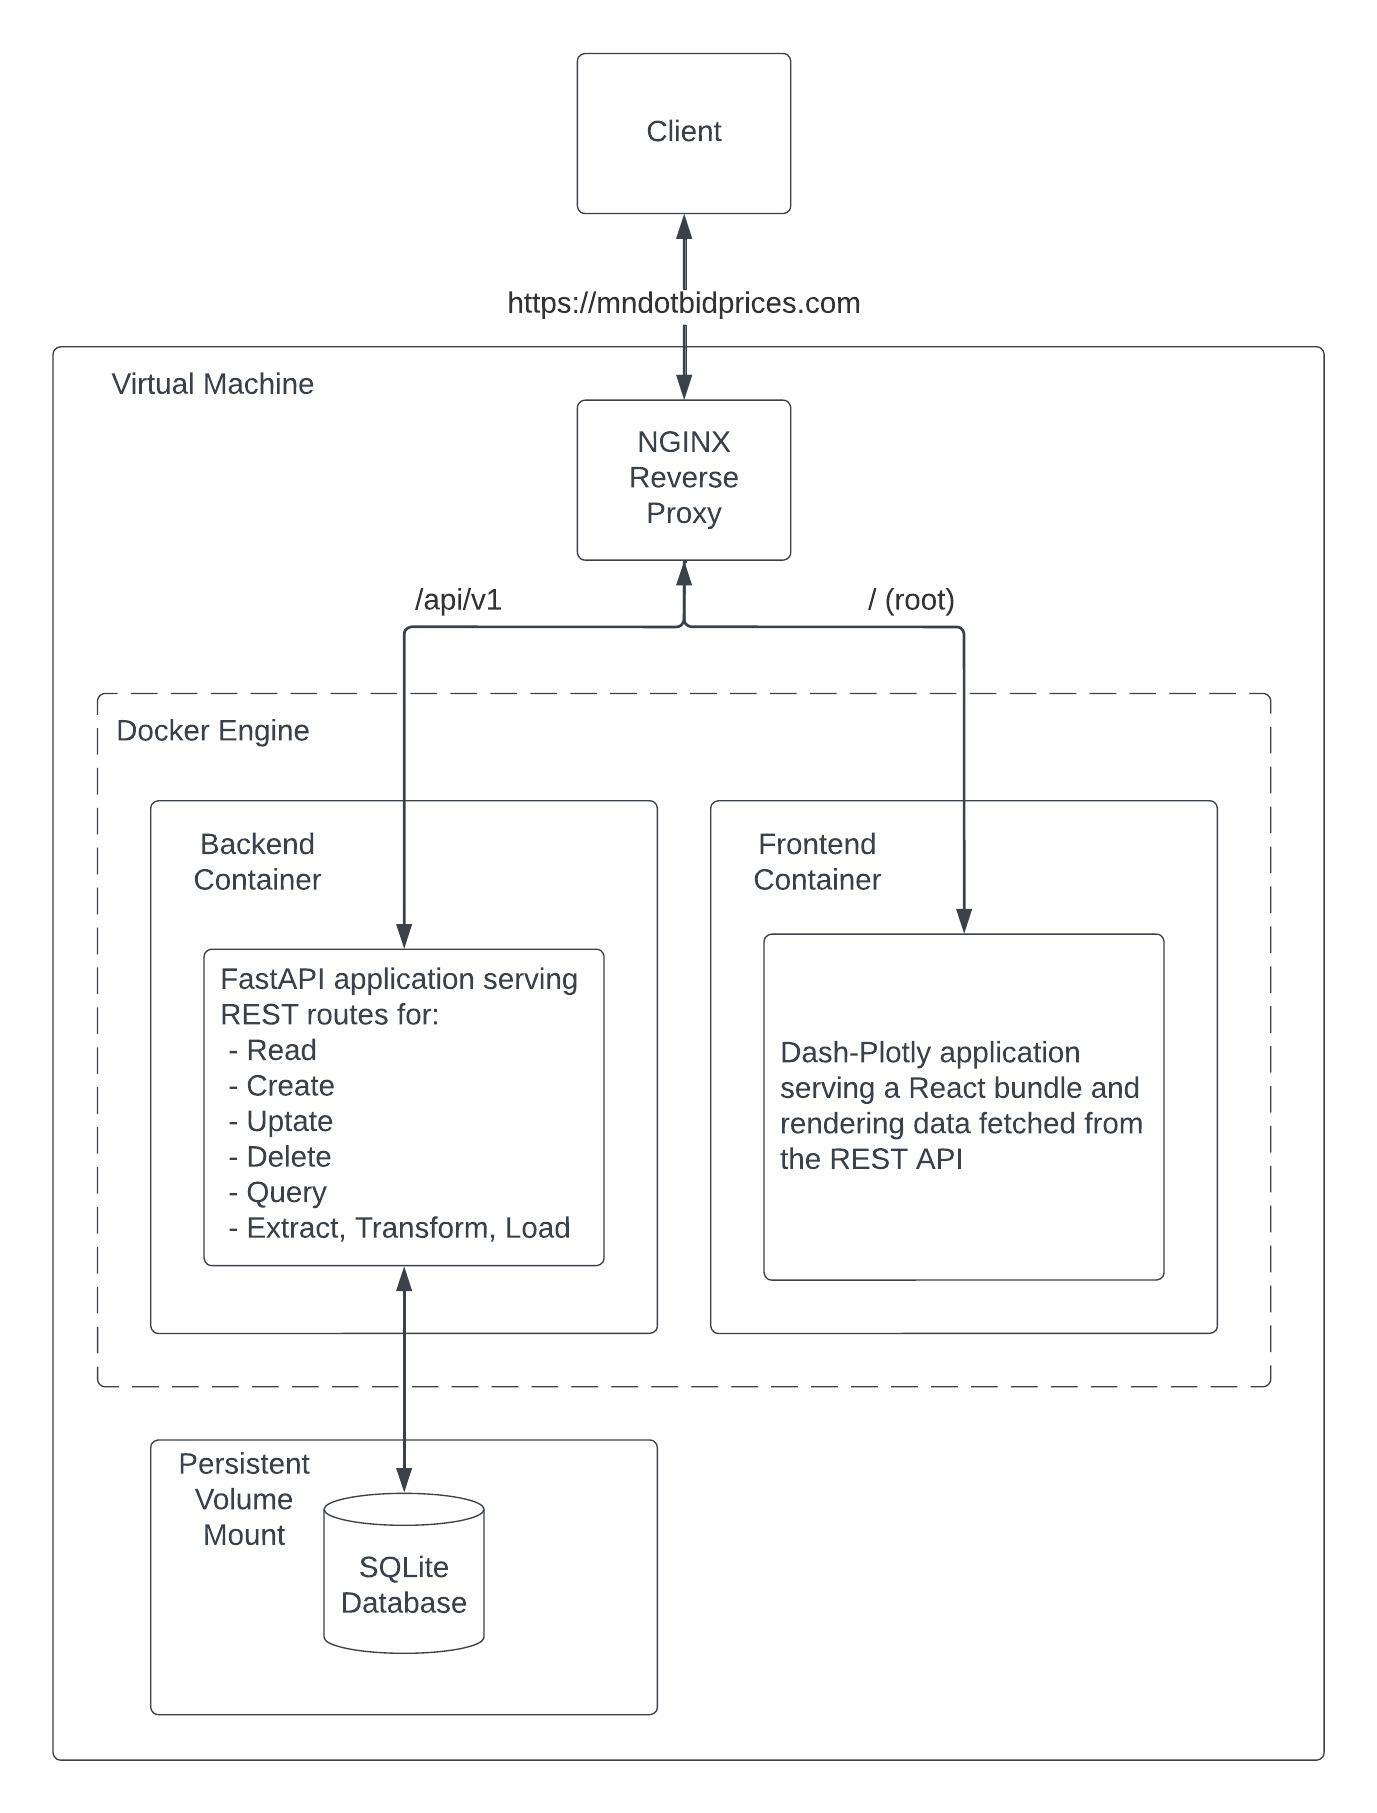
The frontend and backend applications are each run in docker containers. They are currently being run side by side on a low powered Ubuntu virtual machine with a public IP. An NGINX reverse proxy routes requests to the appropriate internal IP assigned to each process. The SQLite database is stored on a persistent volume block that is mounted to the virtual machine, which only the backend accesses.
I chose this configuration for its modularity, simplicity, and low hosting costs. Details behind my choices are outlined below.
SQLite is more than adequate for this small-data application and its use removes the complexity of running a third container to power a PostGreSQL or MySQL database. It is often cited as not suitable for a production environment due to its lack of concurrent write capabilities, however I am the only one with write access in the application's current configuration.
I wanted to keep the frontend and backend processes completely separate. I'm not certain that Dash-Plotly will be the final frontend framework for this project, I would like to try creating the frontend in a JavaScript framework in the future. Since the processes only interact via the REST API, I am free to modify, move, or replace the frontend without impacting the backend.
In the meantime, both processes require minimal resources and traffic is near-zero, so the low powered virtual machine can easily host both simialtanously. This both keeps my hosting costs low and simplifies routing of the traffic to each process.